


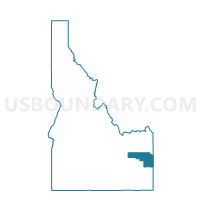
Census Tract 9701, Bonneville County, Idaho
About
Outline

Summary
| Unique Area Identifier | 452315 |
| Name | Census Tract 9701 |
| County | Bonneville County |
| State | Idaho |
| Area (square miles) | 1,459.56 |
| Land Area (square miles) | 1,427.06 |
| Water Area (square miles) | 32.50 |
| % of Land Area | 97.77 |
| % of Water Area | 2.23 |
| Latitude of the Internal Point | 43.36682970 |
| Longtitude of the Internal Point | -111.43756280 |
| Total Population | 5,125 |
| Total Housing Units | 2,241 |
| Total Households | 1,739 |
| Median Age | 40.6 |
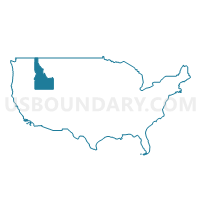
Maps

Graphs
Select a template below for downloading or customizing gragh for Census Tract 9701, Bonneville County, Idaho


Neighbors
Neighoring Census Tract (by Name) Neighboring Census Tract on the Map
- Census Tract 9501, Bingham County, ID
- Census Tract 9502, Bingham County, ID
- Census Tract 9504, Madison County, ID
- Census Tract 9601, Teton County, ID
- Census Tract 9602, Caribou County, ID
- Census Tract 9604, Jefferson County, ID
- Census Tract 9676, Teton County, WY
- Census Tract 9703, Bonneville County, ID
- Census Tract 9704.02, Bonneville County, ID
- Census Tract 9705.01, Bonneville County, ID
- Census Tract 9705.03, Bonneville County, ID
- Census Tract 9714, Bonneville County, ID
- Census Tract 9780, Lincoln County, WY
Top 10 Neighboring County Subdivision (by Population) Neighboring County Subdivision on the Map
- Idaho Falls CCD, Bonneville County, ID (95,095)
- Afton CCD, Lincoln County, WY (12,578)
- Shelley CCD, Bingham County, ID (8,203)
- Ucon CCD, Bonneville County, ID (6,125)
- Victor CCD, Teton County, ID (5,043)
- Driggs CCD, Teton County, ID (3,385)
- Ririe CCD, Jefferson County, ID (1,781)
- Swan Valley CCD, Bonneville County, ID (1,276)
- Alridge CCD, Bingham County, ID (573)
- Alta CCD, Teton County, WY (544)
Top 10 Neighboring Place (by Population) Neighboring Place on the Map
- Idaho Falls city, ID (56,813)
- Ammon city, ID (13,816)
- Alpine Northwest CDP, WY (244)
- Irwin city, ID (219)
- Swan Valley city, ID (204)
Top 10 Neighboring Unified School District (by Population) Neighboring Unified School District on the Map
- Idaho Falls School District 91, ID (56,313)
- Bonneville Joint School District 93, ID (45,322)
- Madison School District 321, ID (33,461)
- Teton County School District 1, WY (21,294)
- Lincoln County School District 2, WY (13,408)
- Teton County School District 401, ID (10,170)
- Shelley Joint School District 60, ID (9,417)
- Soda Springs Joint School District 150, ID (4,338)
- Firth School District 59, ID (3,928)
- Ririe Joint School District 252, ID (2,557)
Top 10 Neighboring State Legislative District Lower Chamber (by Population) Neighboring State Legislative District Lower Chamber on the Map
- State House District 32, ID (56,073)
- State House District 34, ID (49,686)
- State House District 31, ID (45,173)
- State House District 35, ID (43,409)
- State House District 28, ID (41,905)
- State House District 22, WY (12,218)
- State House District 21, WY (10,966)
- State House District 23, WY (9,763)
Top 10 Neighboring State Legislative District Upper Chamber (by Population) Neighboring State Legislative District Upper Chamber on the Map
- State Senate District 32, ID (56,073)
- State Senate District 34, ID (49,686)
- State Senate District 31, ID (45,173)
- State Senate District 35, ID (43,409)
- State Senate District 28, ID (41,905)
- State Senate District 16, WY (23,184)
- State Senate District 17, WY (19,969)
Top 10 Neighboring 111th Congressional District (by Population) Neighboring 111th Congressional District on the Map
Top 10 Neighboring 5-Digit ZIP Code Tabulation Area (by Population) Neighboring 5-Digit ZIP Code Tabulation Area on the Map
- 83401, ID (37,966)
- 83402, ID (26,069)
- 83404, ID (21,606)
- 83442, ID (19,250)
- 83406, ID (15,902)
- 83274, ID (9,246)
- 83455, ID (4,970)
- 83014, WY (3,595)
- 83236, ID (2,275)
- 83128, WY (1,601)
Data
Demographic, Population, Households, and Housing Units
** Data sources from census 2010 **
Show Data on Map
Download Full List as CSV
Download Quick Sheet as CSV
| Subject | This Area | Bonneville County | Idaho | National |
|---|---|---|---|---|
| POPULATION | ||||
| Total Population Map | 5,125 | 104,234 | 1,567,582 | 308,745,538 |
| POPULATION, HISPANIC OR LATINO ORIGIN | ||||
| Not Hispanic or Latino Map | 4,977 | 92,322 | 1,391,681 | 258,267,944 |
| Hispanic or Latino Map | 148 | 11,912 | 175,901 | 50,477,594 |
| POPULATION, RACE | ||||
| White alone Map | 4,958 | 94,411 | 1,396,487 | 223,553,265 |
| Black or African American alone Map | 8 | 585 | 9,810 | 38,929,319 |
| American Indian and Alaska Native alone Map | 12 | 790 | 21,441 | 2,932,248 |
| Asian alone Map | 39 | 856 | 19,069 | 14,674,252 |
| Native Hawaiian and Other Pacific Islander alone Map | 3 | 86 | 2,317 | 540,013 |
| Some Other Race alone Map | 57 | 5,334 | 79,523 | 19,107,368 |
| Two or More Races Map | 48 | 2,172 | 38,935 | 9,009,073 |
| POPULATION, SEX | ||||
| Male Map | 2,623 | 51,996 | 785,324 | 151,781,326 |
| Female Map | 2,502 | 52,238 | 782,258 | 156,964,212 |
| POPULATION, AGE (18 YEARS) | ||||
| 18 years and over Map | 3,620 | 71,440 | 1,138,510 | 234,564,071 |
| Under 18 years | 1,505 | 32,794 | 429,072 | 74,181,467 |
| POPULATION, AGE | ||||
| Under 5 years | 285 | 9,975 | 121,772 | 20,201,362 |
| 5 to 9 years | 424 | 9,507 | 121,195 | 20,348,657 |
| 10 to 14 years | 485 | 8,352 | 116,955 | 20,677,194 |
| 15 to 17 years | 311 | 4,960 | 69,150 | 12,954,254 |
| 18 and 19 years | 115 | 2,557 | 46,209 | 9,086,089 |
| 20 years | 42 | 1,191 | 22,204 | 4,519,129 |
| 21 years | 42 | 1,161 | 21,776 | 4,354,294 |
| 22 to 24 years | 91 | 3,927 | 64,229 | 12,712,576 |
| 25 to 29 years | 162 | 7,776 | 106,734 | 21,101,849 |
| 30 to 34 years | 248 | 7,526 | 102,231 | 19,962,099 |
| 35 to 39 years | 321 | 6,233 | 96,845 | 20,179,642 |
| 40 to 44 years | 325 | 5,736 | 94,764 | 20,890,964 |
| 45 to 49 years | 425 | 6,699 | 103,560 | 22,708,591 |
| 50 to 54 years | 427 | 6,509 | 104,977 | 22,298,125 |
| 55 to 59 years | 444 | 5,992 | 96,997 | 19,664,805 |
| 60 and 61 years | 138 | 2,087 | 35,125 | 7,113,727 |
| 62 to 64 years | 184 | 2,703 | 48,191 | 9,704,197 |
| 65 and 66 years | 114 | 1,500 | 27,113 | 5,319,902 |
| 67 to 69 years | 131 | 2,016 | 36,315 | 7,115,361 |
| 70 to 74 years | 189 | 2,611 | 46,106 | 9,278,166 |
| 75 to 79 years | 107 | 1,996 | 34,278 | 7,317,795 |
| 80 to 84 years | 63 | 1,637 | 25,614 | 5,743,327 |
| 85 years and over | 52 | 1,583 | 25,242 | 5,493,433 |
| MEDIAN AGE BY SEX | ||||
| Both sexes Map | 40.60 | 31.70 | 34.60 | 37.20 |
| Male Map | 41.30 | 31.00 | 33.70 | 35.80 |
| Female Map | 40.10 | 32.40 | 35.40 | 38.50 |
| HOUSEHOLDS | ||||
| Total Households Map | 1,739 | 36,629 | 579,408 | 116,716,292 |
| HOUSEHOLDS, HOUSEHOLD TYPE | ||||
| Family households: Map | 1,432 | 26,787 | 403,144 | 77,538,296 |
| Husband-wife family Map | 1,339 | 21,511 | 320,390 | 56,510,377 |
| Other family: Map | 93 | 5,276 | 82,754 | 21,027,919 |
| Male householder, no wife present Map | 39 | 1,580 | 27,085 | 5,777,570 |
| Female householder, no husband present Map | 54 | 3,696 | 55,669 | 15,250,349 |
| Nonfamily households: Map | 307 | 9,842 | 176,264 | 39,177,996 |
| Householder living alone Map | 255 | 8,217 | 137,785 | 31,204,909 |
| Householder not living alone Map | 52 | 1,625 | 38,479 | 7,973,087 |
| HOUSEHOLDS, HISPANIC OR LATINO ORIGIN OF HOUSEHOLDER | ||||
| Not Hispanic or Latino householder: Map | 1,706 | 33,715 | 535,994 | 103,254,926 |
| Hispanic or Latino householder: Map | 33 | 2,914 | 43,414 | 13,461,366 |
| HOUSEHOLDS, RACE OF HOUSEHOLDER | ||||
| Householder who is White alone | 1,705 | 34,042 | 533,392 | 89,754,352 |
| Householder who is Black or African American alone | 0 | 171 | 2,797 | 14,129,983 |
| Householder who is American Indian and Alaska Native alone | 6 | 247 | 6,918 | 939,707 |
| Householder who is Asian alone | 11 | 314 | 5,989 | 4,632,164 |
| Householder who is Native Hawaiian and Other Pacific Islander alone | 2 | 31 | 667 | 143,932 |
| Householder who is Some Other Race alone | 14 | 1,373 | 20,422 | 4,916,427 |
| Householder who is Two or More Races | 1 | 451 | 9,223 | 2,199,727 |
| HOUSEHOLDS, HOUSEHOLD TYPE BY HOUSEHOLD SIZE | ||||
| Family households: Map | 1,432 | 26,787 | 403,144 | 77,538,296 |
| 2-person household Map | 670 | 10,613 | 174,880 | 31,882,616 |
| 3-person household Map | 233 | 5,449 | 82,320 | 17,765,829 |
| 4-person household Map | 209 | 4,747 | 73,241 | 15,214,075 |
| 5-person household Map | 157 | 3,091 | 40,522 | 7,411,997 |
| 6-person household Map | 93 | 1,785 | 19,662 | 3,026,278 |
| 7-or-more-person household Map | 70 | 1,102 | 12,519 | 2,237,501 |
| Nonfamily households: Map | 307 | 9,842 | 176,264 | 39,177,996 |
| 1-person household Map | 255 | 8,217 | 137,785 | 31,204,909 |
| 2-person household Map | 43 | 1,320 | 29,251 | 6,360,012 |
| 3-person household Map | 6 | 200 | 5,222 | 992,156 |
| 4-person household Map | 2 | 74 | 2,086 | 411,171 |
| 5-person household Map | 1 | 21 | 801 | 126,634 |
| 6-person household Map | 0 | 9 | 960 | 48,421 |
| 7-or-more-person household Map | 0 | 1 | 159 | 34,693 |
| HOUSING UNITS | ||||
| Total Housing Units Map | 2,241 | 39,731 | 667,796 | 131,704,730 |
| HOUSING UNITS, OCCUPANCY STATUS | ||||
| Occupied Map | 1,739 | 36,629 | 579,408 | 116,716,292 |
| Vacant Map | 502 | 3,102 | 88,388 | 14,988,438 |
| HOUSING UNITS, OCCUPIED, TENURE | ||||
| Owned with a mortgage or a loan Map | 1,072 | 19,165 | 286,971 | 52,979,430 |
| Owned free and clear Map | 507 | 7,171 | 117,932 | 23,006,644 |
| Renter occupied Map | 160 | 10,293 | 174,505 | 40,730,218 |
| HOUSING UNITS, VACANT, VACANCY STATUS | ||||
| For rent Map | 15 | 1,073 | 16,360 | 4,137,567 |
| Rented, not occupied Map | 1 | 40 | 997 | 206,825 |
| For sale only Map | 60 | 697 | 12,814 | 1,896,796 |
| Sold, not occupied Map | 8 | 110 | 2,177 | 421,032 |
| For seasonal, recreational, or occasional use Map | 369 | 624 | 41,660 | 4,649,298 |
| For migrant workers Map | 7 | 51 | 632 | 24,161 |
| Other vacant Map | 42 | 507 | 13,748 | 3,652,759 |
| HOUSING UNITS, OCCUPIED, AVERAGE HOUSEHOLD SIZE BY TENURE | ||||
| Total: Map | 2.94 | 2.81 | 2.66 | 2.58 |
| Owner occupied Map | 2.96 | 2.92 | 2.70 | 2.65 |
| Renter occupied Map | 2.81 | 2.55 | 2.56 | 2.44 |
| HOUSING UNITS, OCCUPIED, TENURE BY RACE OF HOUSEHOLDER | ||||
| Owner occupied: Map | 1,579 | 26,336 | 404,903 | 75,986,074 |
| Householder who is White alone Map | 1,547 | 24,954 | 380,646 | 63,446,275 |
| Householder who is Black or African American alone Map | 0 | 74 | 1,027 | 6,261,464 |
| Householder who is American Indian and Alaska Native alone Map | 6 | 122 | 3,961 | 509,588 |
| Householder who is Asian alone Map | 11 | 221 | 3,586 | 2,688,861 |
| Householder who is Native Hawaiian and Other Pacific Islander alone Map | 2 | 17 | 316 | 61,911 |
| Householder who is Some Other Race alone Map | 12 | 730 | 10,510 | 1,975,817 |
| Householder who is Two or More Races Map | 1 | 218 | 4,857 | 1,042,158 |
| Renter occupied: Map | 160 | 10,293 | 174,505 | 40,730,218 |
| Householder who is White alone Map | 158 | 9,088 | 152,746 | 26,308,077 |
| Householder who is Black or African American alone Map | 0 | 97 | 1,770 | 7,868,519 |
| Householder who is American Indian and Alaska Native alone Map | 0 | 125 | 2,957 | 430,119 |
| Householder who is Asian alone Map | 0 | 93 | 2,403 | 1,943,303 |
| Householder who is Native Hawaiian and Other Pacific Islander alone Map | 0 | 14 | 351 | 82,021 |
| Householder who is Some Other Race alone Map | 2 | 643 | 9,912 | 2,940,610 |
| Householder who is Two or More Races Map | 0 | 233 | 4,366 | 1,157,569 |
| HOUSING UNITS, OCCUPIED, TENURE BY HISPANIC OR LATINO ORIGIN OF HOUSEHOLDER | ||||
| Owner occupied: Map | 1,579 | 26,336 | 404,903 | 75,986,074 |
| Not Hispanic or Latino householder Map | 1,551 | 24,797 | 381,867 | 69,617,625 |
| Hispanic or Latino householder Map | 28 | 1,539 | 23,036 | 6,368,449 |
| Renter occupied: Map | 160 | 10,293 | 174,505 | 40,730,218 |
| Not Hispanic or Latino householder Map | 155 | 8,918 | 154,127 | 33,637,301 |
| Hispanic or Latino householder Map | 5 | 1,375 | 20,378 | 7,092,917 |
| HOUSING UNITS, OCCUPIED, TENURE BY HOUSEHOLD SIZE | ||||
| Owner occupied: Map | 1,579 | 26,336 | 404,903 | 75,986,074 |
| 1-person household Map | 216 | 4,713 | 81,134 | 16,453,569 |
| 2-person household Map | 666 | 9,323 | 157,743 | 27,618,605 |
| 3-person household Map | 214 | 4,042 | 59,602 | 12,517,563 |
| 4-person household Map | 188 | 3,622 | 54,046 | 10,998,793 |
| 5-person household Map | 145 | 2,372 | 29,170 | 5,057,765 |
| 6-person household Map | 86 | 1,392 | 14,207 | 1,965,796 |
| 7-or-more-person household Map | 64 | 872 | 9,001 | 1,373,983 |
| Renter occupied: Map | 160 | 10,293 | 174,505 | 40,730,218 |
| 1-person household Map | 39 | 3,504 | 56,651 | 14,751,340 |
| 2-person household Map | 47 | 2,610 | 46,388 | 10,624,023 |
| 3-person household Map | 25 | 1,607 | 27,940 | 6,240,422 |
| 4-person household Map | 23 | 1,199 | 21,281 | 4,626,453 |
| 5-person household Map | 13 | 740 | 12,153 | 2,480,866 |
| 6-person household Map | 7 | 402 | 6,415 | 1,108,903 |
| 7-or-more-person household Map | 6 | 231 | 3,677 | 898,211 |
Loading...